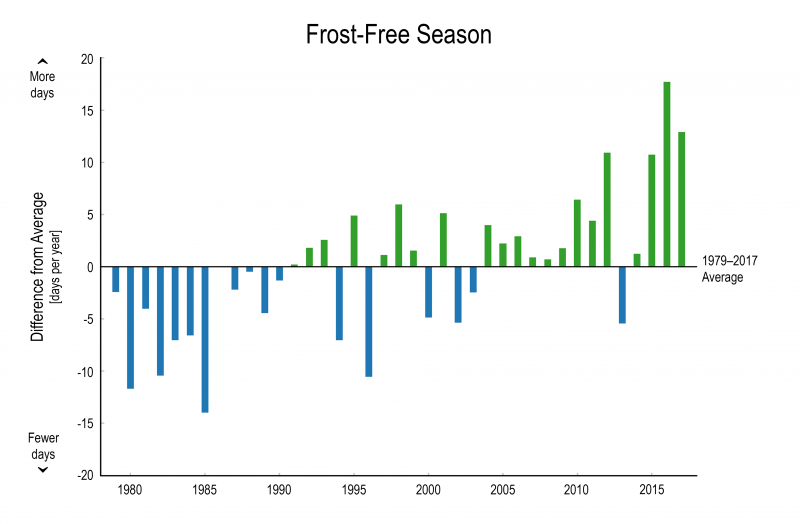
During the past 30 years, there has been an increase in the length of the frost-free season over the contiguous United States and Alaska, relative to the 1979–2017 average. The bars on the graph show the difference between the number of frost-free days in each year and the average number of frost-free days from 1979 to 2017.
Source:
Page/s that contain this image:
Last modified:
17 September 2019 - 12:53pm

