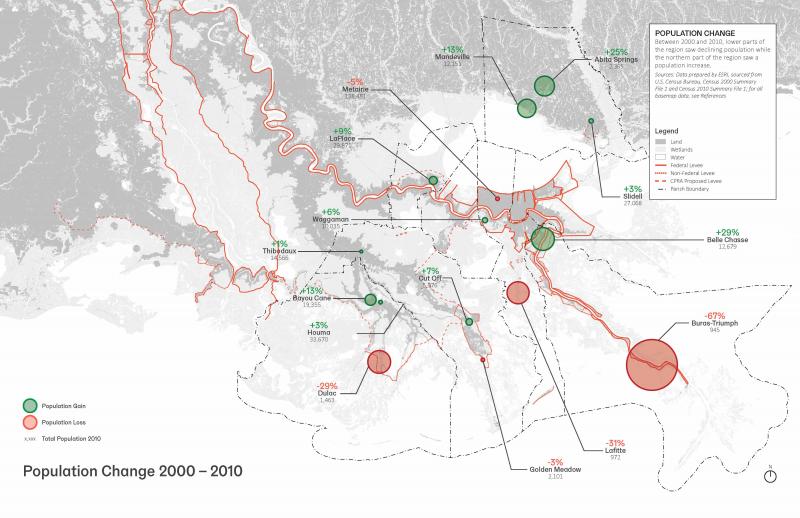
Census data from 2000 and 2010 show population is generally decreasing in the southern part of Louisiana and increasing further north. Click the map for a larger view and source information.
Source:
LA SAFE Regional Population Shift 2010–2020. Map: Esri.
Page/s that contain this image:
Last modified:
23 June 2021 - 5:13pm

